
Raul Ferreira De Souza, APM Engineer, created a new TechTalk about Synthetic Monitoring. If you want to learn more, watch the full video now or read his blog
Videos
Blog post – Synthetic monitoring
- Introduction
- Synthetic Monitoring
- HTTP Monitoring
- Browser Monitoring
- Implementation examples
- Dynatrace
- Elastic Stack
- Videos
Introduction:
- How do you know if your applications and services are up and running?
- How do you measure your applications and services’ availability?
- Are your vendors’ services within their SLAs?
Synthetic monitoring can be a quick, easy, and configurable way to help you answer all of these questions.
Synthetic Monitoring:
Synthetic monitoring refers to every automated measure that emulates users’ or systems’ behaviors. For example: say one of the ways your users interact with your business is through a website – typically the entry point for that interaction will be the website’s homepage. To make sure that the homepage is up and running as expected, we can have an automated periodic check on it. That check will let us know if the page is available and if it is performing as expected, and in case it isn’t, it is very useful to let us quickly understand what is happening and fix the problem.
This monitoring is also possible for external services that your applications consume, which can help you keep track of whether their delivery is consistent with the agreed SLAs.
Synthetic monitoring can vary in complexity and capacity depending on your needs and on what tools are available to you. Depending on the tool, there are different protocols available to use with synthetic monitoring. We will focus on the two most common and useful types:
HTTP Monitoring:
The simplest form of synthetic monitoring is HTTP monitoring. It consists of HTTP calls, commonly a GET or a POST, complete with the validation of the returned HTTP status code. This type of monitoring is a good fit for:
- Application or service availability monitoring
- Certificate expiry date monitoring
- Services response time monitoring
Browser Monitoring
As the name suggests, browser monitoring is done with a web browser. It allows us to utilize applications as close to a real user as possible. With this setting, we can map and emulate complex user journeys through our applications, this allows us to get results, and web metrics and spot problems that wouldn’t be possible just with HTTP monitoring.
One of the other advantages of this type of monitor is that for each configured step, a screenshot will be captured, allowing for an easier analysis process in case of any detected issues.
This type of monitoring is a good fit for:
- Complex user journeys monitoring
- Web resources monitoring
Implementation examples
For the web page https://wapp-app.azurewebsites.net/ , I want a simple HTTP monitor to tell me if the home page is accessible and, a browser monitor to verify that the student search and detail access functionality is working as expected.
To demonstrate the possibilities of implementation, we’ve set up the same synthetic monitors with different tools:
- Dynatrace
- Pros
- Easy configuration for the monitors with many available public locations
- Traceability with other monitored components
- Challenges
- License cost management
- Pros
- Elastic stack (Elasticsearch + Heartbeat + Kibana)
- Pros
- Cost efficient
- Extensive monitor customization
- Challenges
- Maintainability for large environments
- Pros
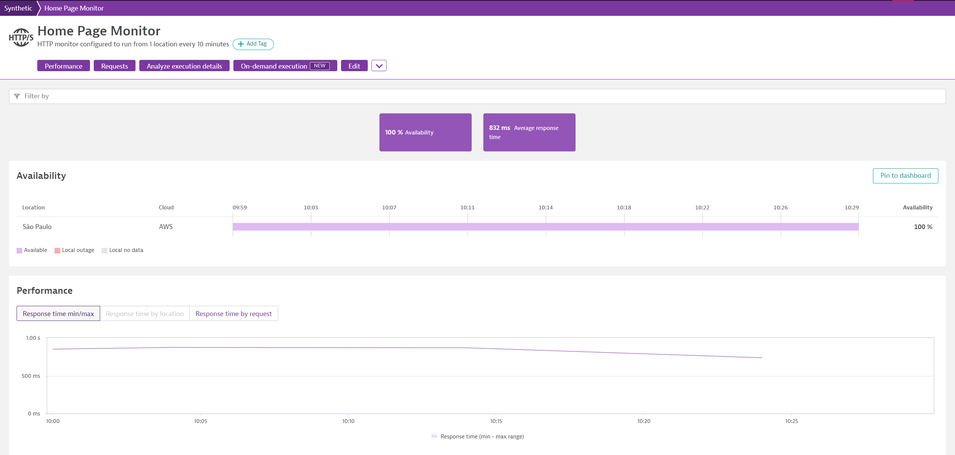
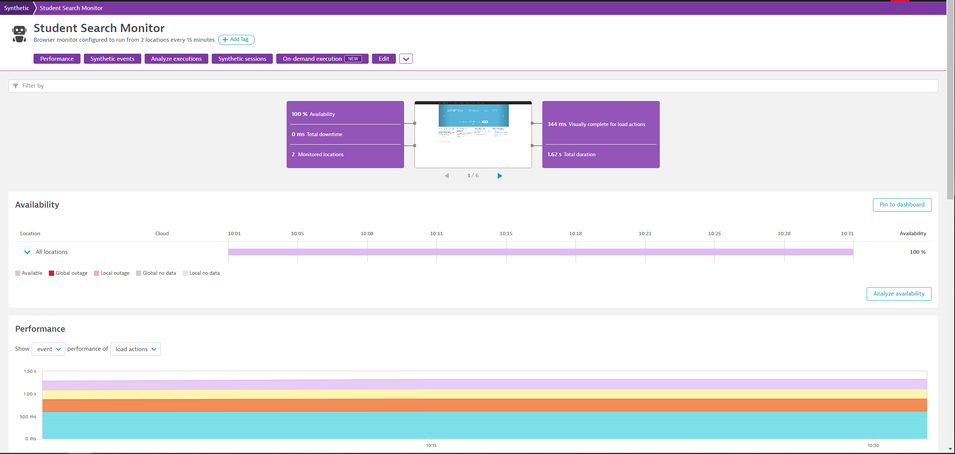
Dynatrace
HTTP Monitor Overview
Browser Monitor Overview

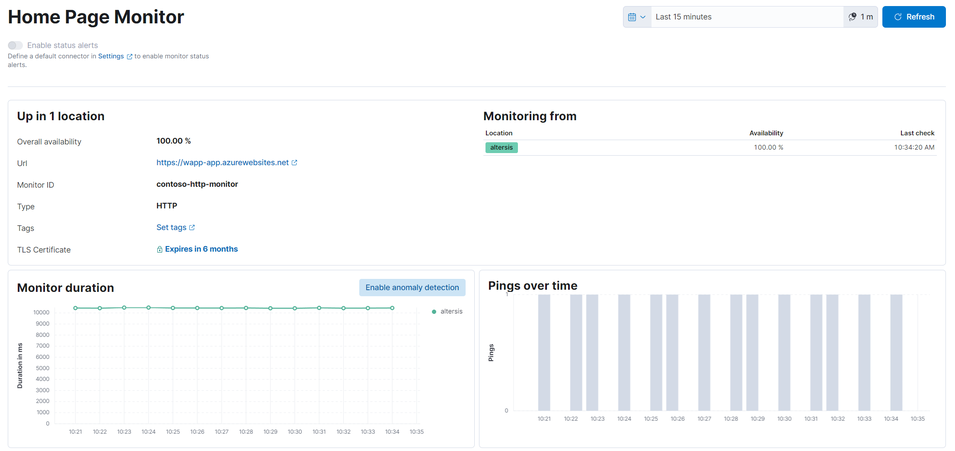
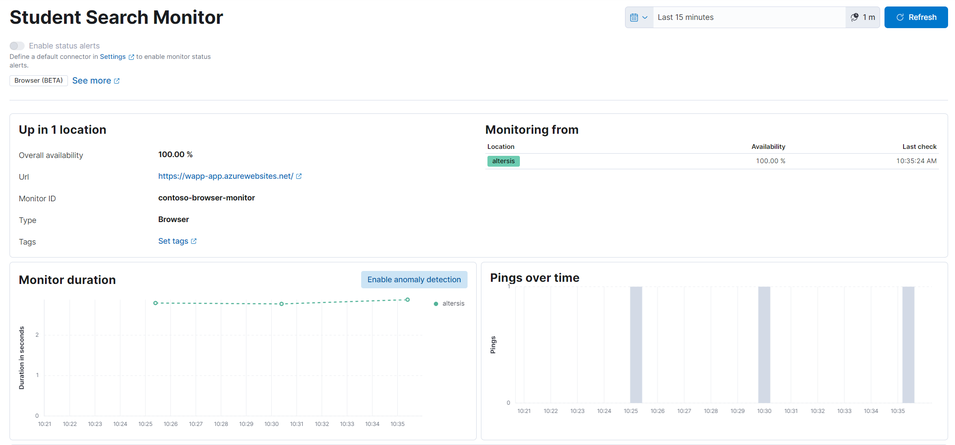
Elastic Stack
HTTP Monitor
Browser Monitor


0 Comments