
Did you have any issues trying to purchase something on Black Friday? Performance issues can make or break online retailers’ profits. Check out our assessment of some popular sites here in Switzerland and see how well they fared!
Introduction
So the dust has settled from another Black Friday weekend. Hope you found all the bargains you wanted! Were you able to access all the online sales? How would you rate your user experience?
It’s well proven that improving the user experience will increase customer satisfaction, usage, conversion, and revenue from your site. Some companies have long ago understood that performance is a major part of that user experience, but for many others, it’s only in recent years that the penalties of poor performance have become clear.
There are many studies out there focusing on performance of U.S. or even world retailers, but not much focused on our own home country. As a proud Swiss performance specialist company, we decided to take a look at some of the most popular Swiss retail sites to see how they match up to web performance good practices.
Read on to see how well they fared!
Our Approach
We decided to focus on the top four high-tech retailers in Switzerland.
(Non-Swiss readers may be interested to know that the Swiss market is quite different from its European neighbours for various reasons, including being an “island“ surrounded by EU countries. See this overview of the Swiss e-commerce market for an introduction.)
We set up simple scripts using Dynatrace synthetic monitoring which visited the site homepage, searched using various popular search terms, then added and removed items from the basket. The same set of steps was run hourly against each site, from Thursday 24th to Tuesday 29th November.
During this time we also checked the sites manually and analysed the page loads using Chrome DevTools which is one of the best, most convenient ways to check the user experience, analyse runtime performance , and find possible optimisations.
Finding
We looked at four of the most well known and influential high-tech retailers in Switzerland. We are keeping the companies anonymous here and will refer to them as Company A, B, C and D, but any Swiss residents are sure to know these companies well.
All of these retailers have both a physical and online presence in Switzerland, with the online part becoming more important each year (92% of sales for one company being online in 2021). As more of your customers are shopping online rather than visiting the real-life store, the importance of ensuring a responsive and smooth experience for your customers increases.
The “store entrance”
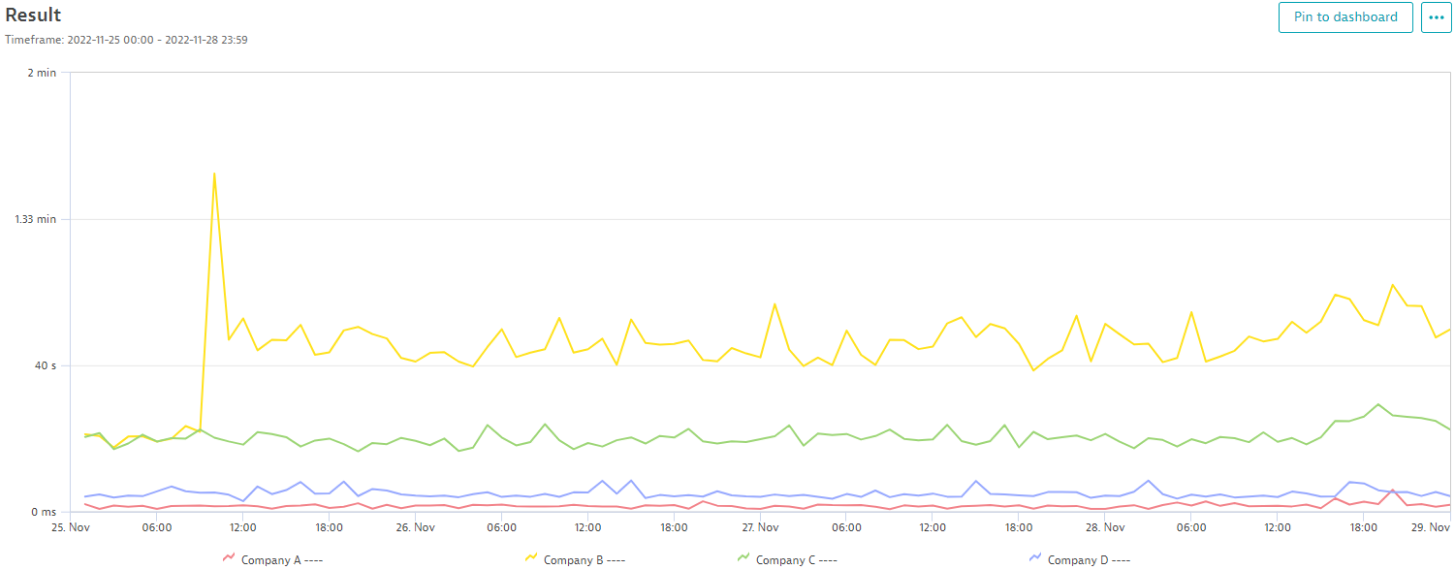
The graph below shows the time taken to open the home page of the four target companies:
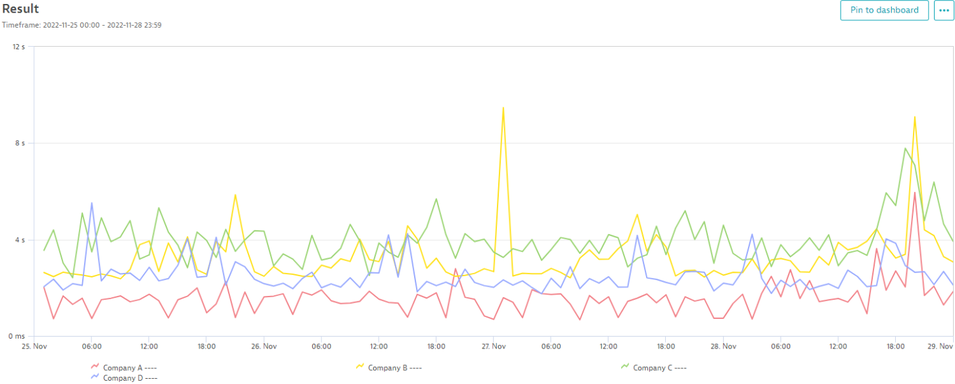
Although at first glance the times don’t seem too different, in the world of web performance there is a big difference between these loading times.
Company A is close to “best in class” with a 1-second loading time, but Company C hovers around the 4-second mark. There is no absolute agreement on the point at which a slow loading page starts to cost you customers, but many studies have shown that 4 seconds is too slow. So Company C is almost certainly losing a percentage of customers – before they have even reached the homepage!
Perhaps because of a last-minute rush as the sales came to an end, there was a general slowdown in response times for all the sites on Monday evening.
Customer experience
Response times are just one measure of performance – there is a great range of metrics to represent the full user experience, starting with the  Core Web Vitals. One useful measure is the
  Speed Index – Chrome Developers which shows how quickly content is visually displayed during page load.
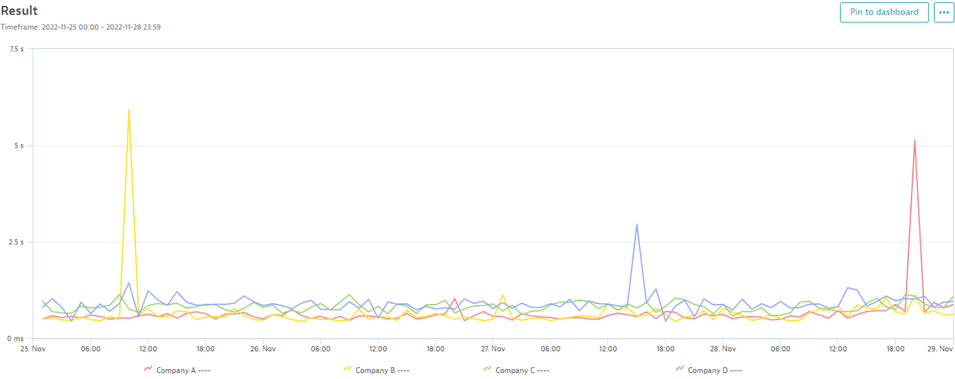
The average Speed Index is rated as good for all four companies (barring occasional spikes) so it’s not all bad news for our anonymous rivals. But this metric, averaging across all page loads, conceals some nasty lurking details.
Filling the basket
Looking at the time to load the product details:
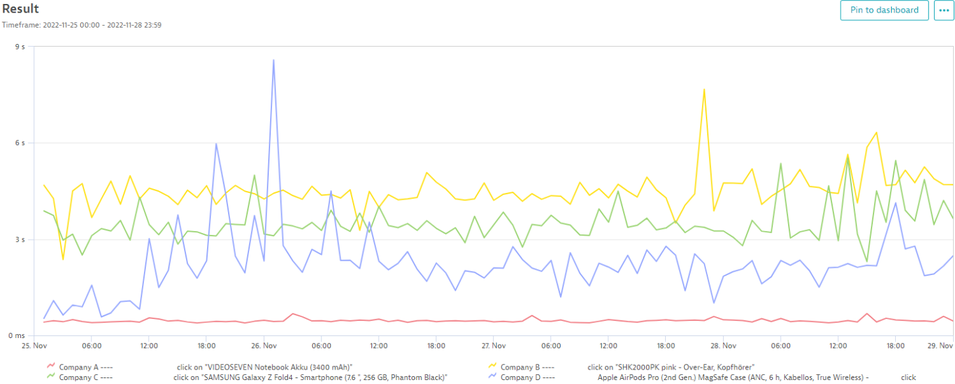
At 8 am on Black Friday, the product page loading time for Company D was 1 second, but this got worse throughout the day, and at the peak time was spiking up to 8 seconds. Just when the Black Friday buying frenzy was reaching its peak, customers could no longer see the details of the item they wanted to buy!
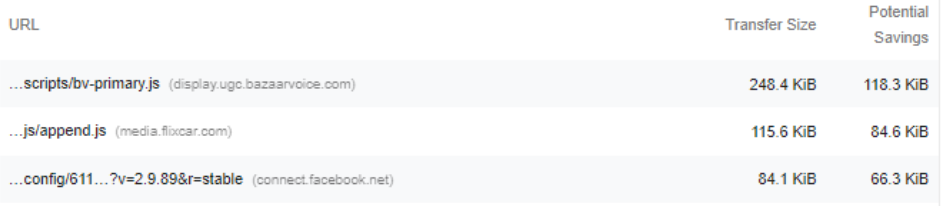
What went wrong? Our page breakdown showed it was the result of 2 API calls where the request took over 5 seconds:
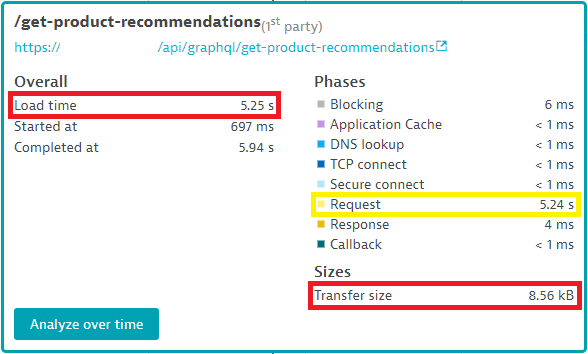
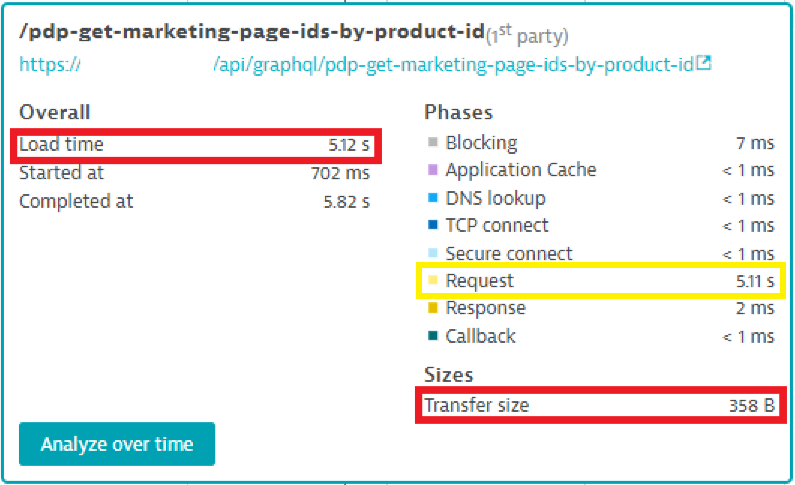
Interestingly, the transfer size for each API was small (less than 9 kB), which suggests that this is caused by delays at the back-end. Maybe their servers simply could not handle the load?
Ask yourself – would you wait for a product page that took over 8 seconds to load?
We would not be surprised if Company D lost business to Company A, which maintained rock-solid performance. If so, this would represent a disaster for Company D which is proud of its high ranking market position!
Let’s quickly take a closer look at these companies, to see if we can get any insights about their online strategy.
Out of the four target companies, Companies A & D had the highest annual revenue in 2021 (both over 1 billion CHF) and tended to have better performance.
Is this purely coincidental? We think not.
Maybe it’s that the biggest companies also have the most money to spend on their sites and end up with the best performance.
But we read it this way: The best performing sites lead to better customer experience, and happy customers spend more time on the site and end up buying more – that’s proven!
How about Companies B and C?
Despite Company B being part of the same parent group as Company A, we observe a significant difference in the user experience between both websites.
At 6 pm on Black Friday, the Home page loading time for Company B was 3.9 seconds, as opposed to 1.3 seconds for Company A. What caused their website to be slow?
Company B had the highest overall time consumed by the workflow of the four target companies:
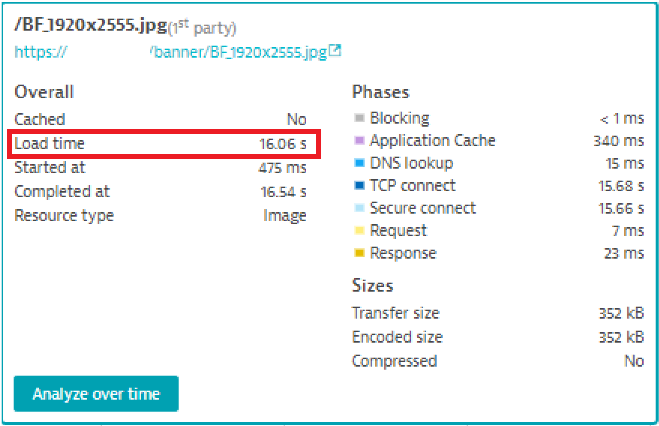
The biggest single cause is their Black Friday banner image, which took a long time to load – going as slow as 16 seconds!
There are a lot of JS and CSS files being loaded, but the speed index is not too high, so we can conclude that the high workflow time for Company B is due to a slower back-end.
When opening the Product page, a large number of unused JS and CSS files are being loaded, wasting over 400 milliseconds:
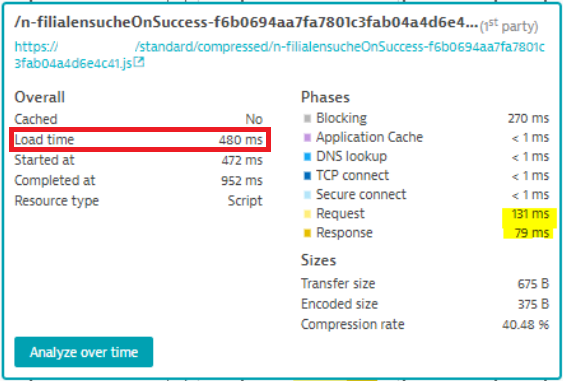
Unused JavaScript files can be reduced or removed – this will reduce the total transfer size:
Company C, a well-known and popular brand with an established presence in Swiss city centres, had the highest average time to load the home page of the website. It has also recorded the lowest revenue out of the four target companies in recent years – perhaps not coincidental?
This was admitted by Company C bosses who stated in their business update that they had failed to place adequate focus and importance on online sales, and this is reflected in the performance that we see. The response time for some pages is the slowest of our monitored group.
How could they have improved? Here are some ideas that would not require a large investment:
- Caching was not properly configured for many resources, resulting in resources being unnecessarily reloaded
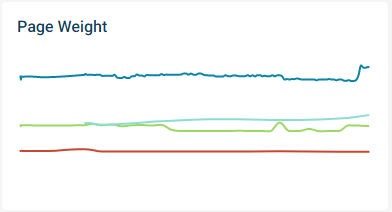
- Page Weight was twice as high as the nearest competitor
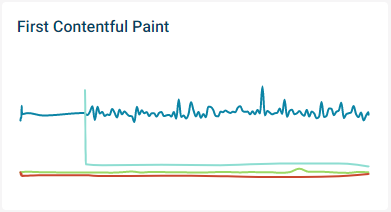
- Time to First Contentful Paint (FCP) was significantly larger than the nearest competitor.
Recommendations
Here are 10 recommendations to improve the customer experience for visitors to your website:
- Compression of resources: for websites with a lot of JavaScript, XML & images this can reduce resource size by up to 88% – reducing page load times
- Implement an efficient caching policy for static resources to speed up your page load times on repeat visits
- Deliver smaller JavaScript payloads and optimize the loading process to improve load times and user experience
- Consider delivering critical JS/CSS inline, and deferring all non-critical JS/CSS to optimize the Critical Rendering Path and improve the First Contentful Paint (FCP)
- Reduce and optimize the use of third-party service requests and resource providers to ensure that these will not affect the performance and interactivity of your site
- Upgrade from HTTP/1.1 to HTTP/2 for improved web performance
- Reduce network payloads to reduce load times & minimize data usage
- Make text visible during the webfont load to improve user perception of page load
- Load third-party resources after the page has finished loading to minimize their performance impact
- Serve images with correctly defined dimensions to conserve users’ data and improve page performance
Conclusions
At Altersis Performance our company purpose is to make people’s daily lives better by improving the performance of software applications – we hope this study is one small step towards that! Judging by these top retailers, the Swiss Black Friday experience was generally acceptable, but there are still many recommendations that all web teams should think about to improve the Swiss shopping experience.
We hope this snapshot was interesting for you – please let us know your comments, we’ll take them into account for future studies.


0 Comments