
Blog Page – Marketing Campaign Monitoring
Introduction:
Let’s imagine that you are working as a Developer, Service Architect, or tester in a company. Definitely, you have heard about Application Performance Management (APM) and how it can help you with your daily tasks.
But have you thought about how the same APM can generate value for other teams in your company (Business Team, Marketing Team, HR, etc.) too?
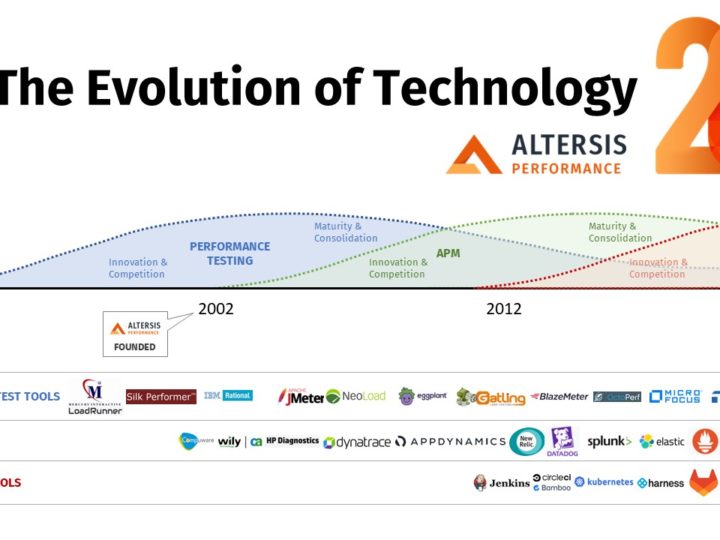
The concept of APM has been updated, and today we can do much more than only trace HTTP requests: They can monitor frontend pages, the response time of these pages, errors, interactions (clicks) or can enable us to see which pages users navigate to in the application.
Based on that, we will cover how to monitor Marketing Campaigns using Dynatrace.
Listed below are 5 benefits of monitoring marketing campaigns using APM tools:
- Know in near-real-time the success of your campaigns
- Correlate business metrics with technical metrics
- Reduce the number of tools used in your organization
- Have a centralized source of data collection
- Provide easier visibility to your company
Properly applied APM can generate value for different teams within the company, and at the same time, will still monitor the application performance from the user’s perspective and trace transactions to the backend services.
UTM Parameters:
If you run a digital business and have different marketing strategies on the internet, you probably have asked yourself these questions:
- How do our users find us?
- Google?
- Partners websites?
- Email marketing?
- What is the ROI for each marketing campaign?
- What is the conversion for each marketing campaign?
- What is the best social media to advertise in?
- How many users came from social media?
- Did they come because an influencer recommended me?
- Which influencer?
- How much did the users that came from influencers spend?
Luckily, as was said in the introduction, we can use APM tools not only to monitor technical performance but to give you all these answers as well.
To track the users and where they came from, companies nowadays are using URL parameters.
We can use a custom parameter and/or UTM parameters.
UTM parameters are codes added to your URL to easily track online traffic. It is simple, straightforward, and reliable.
These are examples of UTM parameters:
- UTM – Campaign: Campaign’s Name
- UTM – Source: Origin of the traffic – From where
- UTM – Campaign Medium: Type of link was used
- UTM – Campaign Content: Content related to the campaign.
- UTM – Campaign Term: Search terms
- CUSTOM – Name of the Influencer
URL Example: http://blog.com/index.html?utm_campaign=blogpost&utm_medium=social&utm_source=facebook
If you have never noticed these parameters before, you can go to google, search for anything, and click on one advertisement link. In the URL, you will find parameters after the “?” character; all these parameters are being monitored.
Dynatrace Configuration:
As was said in the video above, we are using 4 different functionalities in Dynatrace to help you successfully monitor your Marketing Campaigns.
- Session and Action Properties
- Customized Metrics
- User Session Queries
- Dashboards
Collecting Parameters (UTM or Custom)
It’s already been explained what UTM parameters are, but how can we configure them in Dynatrace?
The video above will explain how to configure those parameters in more detail.
In case you are already monitoring your frontend (webpage):
- Click in your application
- Edit it
- Click in Session and action properties
- Add Property
- Configure the properties
From now on for every new user, Dynatrace will collect the UTM parameters and store them in the Session properties.
We can now work with the metrics and present this information.
Create Customized Metrics
Customized metrics are important to specifically measure your data. Using metrics you can easily provide more context to your data, split by dimensions, etc.
To learn more about this watch the video above.
User Session Queries
The User Session Queries give you the flexibility to create a graphic or table and show exactly the data you need.
Below you can find all the queries I have added to my dashboard:
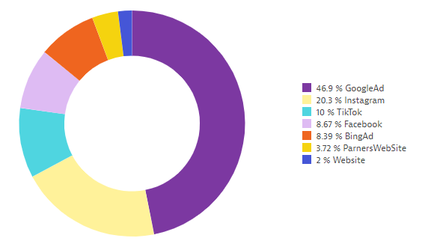
User Sources:
select stringProperties.web_utm_source, COUNT(*) FROM usersession WHERE useraction.application = “Sock Shop” GROUP BY stringProperties.web_utm_source ORDER BY COUNT(*) DESC
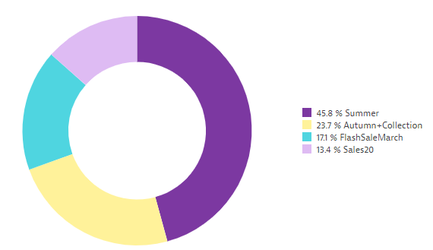
Successful Campaigns:
select stringProperties.web_utm_campaign, COUNT(*) FROM usersession WHERE useraction.application = “Sock Shop” AND stringProperties.web_utm_campaign IS NOT NULL GROUP BY stringProperties.web_utm_campaign ORDER BY COUNT(*) DESC
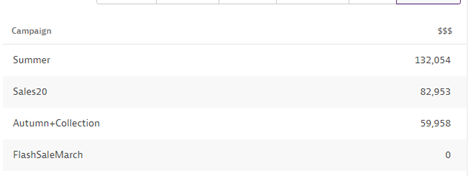
$$$ Campaigns ROI
select stringProperties.web_utm_campaign AS “Campaign”, sum(useraction.doubleProperties.carttotal) as “$$$” FROM usersession WHERE useraction.application = “Sock Shop” AND stringProperties.web_utm_campaign IS NOT NULL GROUP BY stringProperties.web_utm_campaign ORDER BY sum(useraction.doubleProperties.carttotal) DESC
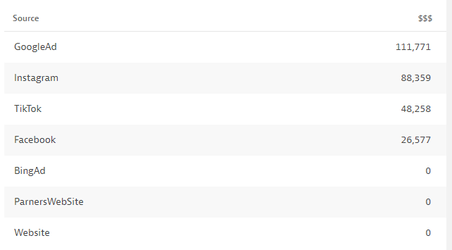
$$$ Source ROI
select stringProperties.web_utm_source AS “Source”, sum(useraction.doubleProperties.carttotal) as “$$$” FROM usersession WHERE useraction.application = “Sock Shop” AND stringProperties.web_utm_source IS NOT NULL GROUP BY stringProperties.web_utm_source ORDER BY sum(useraction.doubleProperties.carttotal) DESC
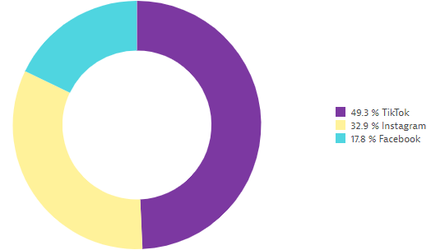
Social Midia – Source
select stringProperties.web_utm_source, COUNT(*) FROM usersession WHERE useraction.application = “Sock Shop” AND stringProperties.web_utm_campaign = “Summer” and stringProperties.web_utm_source IN (“Facebook”, “Instagram”, “TikTok”) GROUP BY stringProperties.web_utm_source ORDER BY COUNT(*) DESC
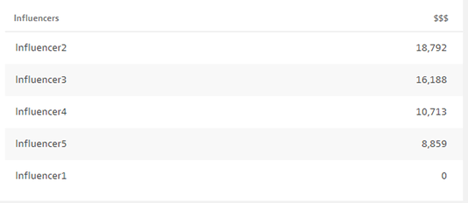
Return from Influencers
select stringProperties.web_utm_content AS “Influencers”, SUM(doubleProperties.carttotal) as “$$$” FROM usersession WHERE useraction.application = “Sock Shop” and stringProperties.web_utm_content STARTSWITH “Influencer” GROUP BY stringProperties.web_utm_content ORDER BY SUM(doubleProperties.carttotal) DESC
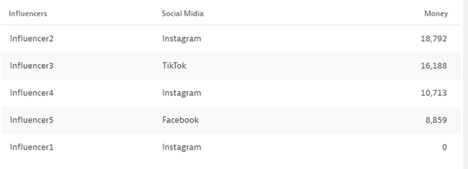
Influencers vs ROI
select stringProperties.web_utm_content AS “Influencers”, stringProperties.web_utm_source AS “Social Midia”, sum(doubleProperties.carttotal) as “Money” FROM usersession WHERE useraction.application = “Sock Shop” and stringProperties.web_utm_content IN (“Influencer1”, “Influencer2”, “Influencer3”, “Influencer4”, “Influencer5”) GROUP BY stringProperties.web_utm_content, stringProperties.web_utm_source ORDER BY sum(doubleProperties.carttotal) DESC
Dashboards
This is the final part of the session – and the best one.
In this session, you can see what the result of your marketing campaign is using Dynatrace. Add all the collected data and create a Dashboard so the marketing Team can follow it live.
To learn more about this and see live examples and dashboards, watch the full video above.
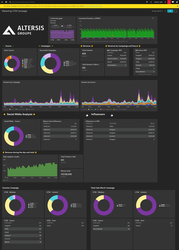
Also, if you like the design of this Dashboard, you can download the JSON file and import to your environment.
json file: jsonfile.docx


0 Comments